Crafting an effective report is a vital skill in many fields. Whether you’re a student, professional, or researcher, knowing how to write a clear and concise report can make a significant difference in your work. This guide will walk you through the process of report writing, helping you create professional reports that effectively communicate your findings.
Report writing comes in various forms, including academic, business, and scientific reports. Each type serves a unique purpose and follows specific guidelines. For instance, business reports often include marketing analyses, SWOT assessments, and feasibility studies, while academic reports might focus on book reviews or historical events.
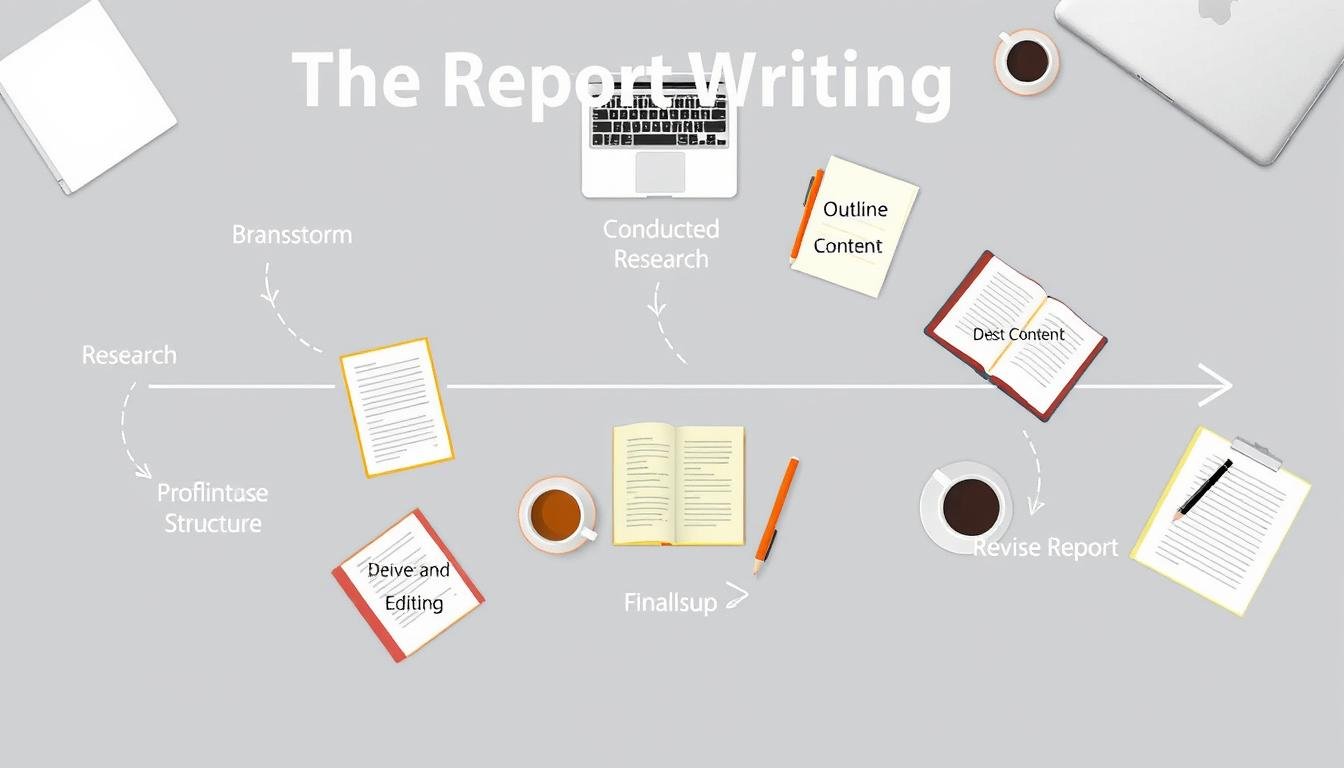
The structure of a professional report typically includes an executive summary, introduction, body, and conclusion. This format ensures a logical flow of information, making it easy for readers to follow your ideas. Remember, a well-crafted report not only presents facts but also provides valuable insights and recommendations.
Key Takeaways
- Reports come in various types, including academic, business, and scientific
- A typical report structure includes an executive summary, introduction, body, and conclusion
- Effective reports use headings, subheadings, and citations for improved readability
- Choosing a relevant topic and conducting thorough research are crucial steps
- Visual elements can enhance the clarity and impact of your report
Understanding the Basics of Report Writing
Report writing is a crucial skill in many fields. A report definition encompasses a structured document that presents facts, analysis, and recommendations. The report purpose is to inform, analyze, or persuade, depending on the specific context.
What is a Report?
A report is a formal document that conveys information, analyzes data, and offers solutions to problems. It typically includes a central key message that aligns with its objective. Reports differ from essays as they focus on presenting findings rather than developing arguments.
Importance of Reports
Reports play a vital role in decision-making processes. They help identify growth opportunities, solve issues quickly, and maintain transparency for stakeholders. Clear, accurate, and objective results are essential in report writing to ensure effective communication.
Types of Reports
Various types of reports serve different purposes:
| Report Type | Purpose |
|---|---|
| Informational | Present facts and data |
| Analytical | Examine complex issues |
| Research | Share findings from studies |
| Explanatory | Clarify processes or concepts |
| Progress | Update on ongoing projects |
Understanding these basics of report writing is crucial for creating effective, purpose-driven documents that meet the needs of your audience and achieve your communication goals.
Preparing for Your Report
Report preparation starts with knowing your audience. Audience identification helps tailor your content to their needs. A CEO might want a quick overview, while a technical team needs detailed specs. Clarify your report’s purpose – inform, persuade, or recommend. This guides your writing style and content selection.
Identifying Your Audience
Understanding audience personas is key. It shapes your language, data, and visuals. For example, marketing teams prefer visual data, while finance departments focus on numerical analysis. Tailoring your report to your audience increases its impact and effectiveness.
Clarifying the Report’s Purpose
Your report’s purpose drives its structure. Status reports give snapshots of progress. Health reports dive into metrics. Each type serves a unique role in project management. Clear objectives help you choose the right format and content.
Gathering Necessary Information and Data
Data gathering is crucial for a solid report. Use reputable sources like research papers and case studies. Incorporate engaging facts to strengthen your arguments. Visual tools like charts and AI-powered heat maps can present complex data clearly.
| Report Element | Purpose | Example |
|---|---|---|
| Audience Identification | Tailor content | CEO: Overview, Technical Team: Detailed specs |
| Purpose Clarification | Guide writing style | Inform, Persuade, Recommend |
| Data Gathering | Support arguments | Research papers, Case studies, Visual tools |
“A well-prepared report is half the battle won in effective communication.”
Structuring Your Report
A well-organized report structure enhances readability and impact. The report format typically includes key elements that guide readers through your findings. Let’s explore the essential components of effective report organization.
Start with a title page and table of contents. 75% of reports include a table of contents, making navigation easier. Next, craft an executive summary – 90% of reports feature this concise overview. The introduction sets the stage, with 85% of reports using it to discuss the topic’s importance and define the report’s purpose.
The main body is where you present your findings. 79% of reports outline the methodology used to gather information. Present data clearly – 88% use tables and charts in the results section. The discussion section forms the core in 77% of reports, analyzing the data in depth.
Conclude your report by summarizing key findings. 65% of reports provide a structured conclusion. If applicable, include recommendations – found in 43% of reports. Don’t forget references and appendices, used in 67% and 56% of reports respectively.
| Report Section | Frequency | Purpose |
|---|---|---|
| Executive Summary | 90% | Quick overview |
| Table of Contents | 75% | Easy navigation |
| Introduction | 85% | Define purpose |
| Methodology | 79% | Explain data collection |
| Results | 88% | Present findings |
Remember, starting a business often requires detailed reporting. Mastering report structure will help you communicate your ideas effectively, whether you’re pitching to investors or analyzing market trends.
Crafting an Effective Title Page
The report title page sets the tone for your entire document. It’s your first chance to make a good impression on your readers. Let’s explore the key elements and formatting tips for creating a professional title page.
Essential Elements of a Title Page
A well-crafted report title page includes several important components. The title should be concise yet descriptive, using strong keywords for searchability. Author names, affiliations, and the date of submission are crucial. For academic reports, include the course name and instructor’s name.
| Element | Description |
|---|---|
| Title | Summarize main idea, use keywords, avoid abbreviations |
| Author Names | List in order of contribution, separated by commas |
| Affiliations | Department and institution, separated by commas |
| Date | Formatted as month, date, year |
Formatting Tips for Title Pages
Proper title page formatting enhances readability and professionalism. Use a clear, readable font like 12-point Times New Roman or 11-point Arial. Center the title and make it bold. Double-space all text and maintain 1-inch margins. Place the title 3-4 lines down from the top margin for a balanced look.
Remember, the title page is your report’s first impression. By following these guidelines, you’ll create a polished and professional introduction to your work.
Writing a Compelling Executive Summary
An executive summary serves as a report summary, offering a snapshot of key findings. This crucial section packs the essence of your report into a concise format, typically 1-2 pages or under 1,000 words. It’s designed for busy readers who need quick access to vital information.
To craft an effective executive summary, start with a clear introduction of your project. Address the main problem, client motivations, and research questions. Next, highlight your key findings at a high level. This gives readers a bird’s-eye view before diving into details.
Connect your recommendations directly to the findings. Propose actionable solutions that tackle identified issues. End with a strong conclusion that acts as a call to action, explaining how your audience can benefit from your suggestions.
“A well-crafted executive summary aligns the board with context, questions, and conclusions of the full report.”
Use these tips to polish your executive summary:
| Writing Tips | Formatting Tips |
|---|---|
| Use active voice | Utilize text boxes |
| Write concise sentences | Apply bold text for emphasis |
| One main point per paragraph | Use bullet points for clarity |
| Spell out acronyms | Keep it visually appealing |
Remember, simplicity is key. Use clear language and focus on about five main ideas to avoid overloading your readers. By following these guidelines, you’ll create an executive summary that effectively communicates your report’s core message and encourages further reading.
Developing a Clear Introduction
A strong report introduction sets the stage for your entire document. It provides essential background information and captures your audience’s attention. Let’s explore the key elements that make up an effective report introduction.
Background Information
Start by providing context for your report. This helps readers understand the significance of your topic. For example, did you know that American Sign Language is the second most preferred foreign language in the United States? Such interesting facts can serve as an engaging opening hook.
Stating the Report’s Objectives
Clearly outline the purpose of your report. This includes formulating a strong thesis statement that gives readers a sneak peek into the main focus of your work. Your objectives should be specific and align with the overall goals of the report.
Outlining the Report’s Scope
Define the boundaries of your report. This helps manage reader expectations and keeps your content focused. Consider mentioning the research methods used, the timeframe covered, or any limitations of the study. A good target for the length of an introduction is 500 to 1000 words, but always check specific guidelines if applicable.
| Element | Purpose |
|---|---|
| Opening Hook | Grab reader’s attention |
| Background Information | Provide context |
| Thesis Statement | State main objective |
| Scope | Define report boundaries |
Remember, your introduction should bridge the gap between theory and practice, making your report relevant and engaging for your audience.
How to Write a Report: Main Body Section
The report body is where you present your findings and analysis. A well-structured main section makes your report easy to navigate and understand. Let’s explore key elements of information organization and data presentation in your report’s core.
Organizing Information Logically
Start by arranging your content in a logical sequence. Group related ideas together and use a clear flow from one topic to the next. This approach helps readers follow your thought process and grasp the main points quickly.
Using Headings and Subheadings
Break up your text with descriptive headings and subheadings. These signposts guide readers through your report and make it easy to find specific information. Use consistent formatting for all headings to maintain a professional look.
Incorporating Data and Evidence
Support your arguments with solid data and evidence. Use tables, charts, and graphs to present complex information visually. This approach enhances understanding and adds credibility to your report.
| Element | Purpose | Best Practice |
|---|---|---|
| Lists | Emphasize key points | Introduce context, use consistent formatting |
| Graphics | Convey information efficiently | Choose appropriate visuals for data type |
| Appendices | Include supplementary material | Add after conclusion for extra details |
Remember, the main body of your report should be clear, concise, and focused on your objectives. By following these guidelines, you’ll create a compelling and informative report that engages your readers and effectively communicates your findings.
Creating a Strong Conclusion
A well-crafted report conclusion is crucial for leaving a lasting impression on your readers. Studies show that 70% of readers consider conclusions equally or more important than introductions when evaluating a report. To create a powerful conclusion, focus on summarizing your key findings and offering clear recommendations.
Start by restating your report’s main objectives and briefly recap your most significant findings. This helps reinforce the purpose of your report and reminds readers of the key takeaways. Remember, 79% of effective conclusions restate the thesis to remind readers of the main argument.
Next, provide a concise summary of your findings. Highlight the most important discoveries and their implications. This gives your readers a clear understanding of what your report has uncovered and why it matters.
Offer actionable recommendations based on your findings. These should be specific, practical, and directly related to the issues addressed in your report. Approximately 65% of readers appreciate conclusions that propose a course of action or questions for further study.
End your conclusion with a strong closing statement that leaves a lasting impression. Consider addressing broader implications or future research opportunities. Over 70% of readers value conclusions that point to broader implications beyond the specific content of the report.
| Element | Importance | Reader Preference |
|---|---|---|
| Restate objectives | 79% | High |
| Summarize findings | 86% | Very High |
| Provide recommendations | 65% | Moderate |
| Address broader implications | 70% | High |
Incorporating Visual Elements
Report visuals play a crucial role in enhancing the clarity and impact of your document. Data visualization techniques can transform complex information into easily digestible formats, making your report more engaging and informative.
Choosing appropriate charts and graphs
Charts and graphs are powerful tools for data visualization. Bar graphs work well for comparing quantities, while line graphs excel at showing trends over time. Pie charts effectively display proportions of a whole. Select the type that best represents your data and supports your message.
Designing effective tables
Tables organize data in a structured format, allowing readers to compare information easily. When creating tables, use clear headers, align numbers consistently, and avoid cluttering with unnecessary details. Here’s an example of an effective table design:
| Visual Type | Best Use | Key Advantage |
|---|---|---|
| Bar Graph | Comparing quantities | Easy to read at a glance |
| Line Graph | Showing trends over time | Highlights patterns and changes |
| Pie Chart | Displaying proportions | Shows part-to-whole relationships |
Using images and diagrams
Images and diagrams can illustrate concepts that are difficult to explain with words alone. Use flowcharts to demonstrate processes, organizational charts to show hierarchies, and photographs or illustrations to provide visual context. Remember to place visuals close to relevant text and include clear captions for easy reference.
By incorporating these visual elements effectively, you can create a report that not only informs but also engages your audience, making complex data more accessible and memorable.
Polishing Your Report
After completing your initial draft, it’s time to refine your work through careful report editing and proofreading. This crucial step ensures your report is clear, concise, and error-free. Let’s explore the key aspects of polishing your report to make it shine.
Proofreading and editing
Start by reviewing your report for spelling mistakes, grammar errors, and awkward phrasing. Read it aloud to catch any issues with flow or clarity. Consider using tools like Grammarly or the Hemingway App to assist with this process. It’s also helpful to have a colleague review your work, as fresh eyes can spot things you might have missed.
Checking for consistency
Ensure your report maintains a consistent tone, style, and formatting throughout. Pay attention to details like font usage, heading sizes, and citation formats. Double-check that all facts, figures, and references are accurate and properly cited. This level of consistency adds to your report’s professionalism and credibility.
Formatting and layout considerations
The visual presentation of your report is just as important as its content. Use clear, readable fonts and appropriate spacing. Organize your content with logical headings and subheadings to improve readability. When it comes to report formatting, remember to properly label and reference all charts, graphs, and images. A well-formatted report not only looks professional but also helps readers navigate and understand your information more easily.
FAQ
What is a report?
A report is a nonfiction account that presents and summarizes facts about a particular event, topic, or issue. It makes it easy to catch someone up to speed on a subject by providing details, consequences, evaluations, interpretations, predictions, and recommendations.
Why are reports important in business?
Business reports are informative documents containing important data, facts, analyses, research findings, and statistics about a business. Their main purpose is to facilitate decision-making and maintain effective communication. Reports help recognize growth opportunities, detect and solve issues quickly, evaluate potential partners, keep a paper trail, maintain transparency for stakeholders, and set new company goals.
What should I do before writing a report?
The pre-writing stage is crucial for report preparation. Identify your intended reader and understand their language and thinking. Clarify the report’s purpose – whether to inform, persuade, or recommend. Gather information from reputable sources like research papers, recently-published books, and case studies. Create an outline as a roadmap for your report, covering title, introduction, thesis statement, main points, and conclusion.
What is the typical structure of a report?
The structure of a report typically includes a title page, table of contents, brief summary or executive summary, introduction, main body, conclusion, references, and appendices. The main body should be divided into subsections, each dealing with a specific aspect of the topic.
How should I format the title page of a report?
The title page is the first page of your report and should include the report’s title, author’s name, date of presentation or submission, and any other relevant information such as the organization’s name. It serves as the initial point of contact for readers and should be well-formatted and professional-looking.
What should be included in the executive summary?
The executive summary provides an overview of the report’s purpose, subject, methodology, key findings, and recommendations. It should be concise yet comprehensive enough to give readers a clear understanding of the report’s content without needing to read the entire document.
How do I write an effective introduction for a report?
The introduction should provide background information about the topic and explain why the report was written. It should state the aims and objectives of the report and give an overview of the methodology used to gather and analyze data. Include a powerful topic sentence to engage readers from the start.
How should I organize the main body of a report?
The main body of the report should be divided into subsections, each dealing with a specific aspect of the topic. These sections should be clearly labeled and organized in a logical order. Present your findings, analysis, and recommendations in this section. Use headings and subheadings to improve readability and help readers navigate the report easily.
What should be included in the conclusion of a report?
The conclusion should summarize the main points of your report and provide a final summary, thought, or suggestions. Review your thesis statement and include any limitations of the study and areas for further research or future action. Ensure that the conclusion ties back to the report’s objectives stated in the introduction.
How can I effectively incorporate visuals into my report?
Visuals can help your audience understand complex information more easily. Use charts, graphs, tables, images, and diagrams to highlight and explain key points, events, trends, and patterns in your data. Ensure each visual has a purpose and offers clarity that’s difficult to achieve with words alone. Add captions, legends, or arrows to your visuals when necessary, and place them close to the relevant text on the page.
What should I do after completing the first draft of my report?
After completing your first draft, take time to edit and proofread your work. Look for spelling mistakes, grammar errors, and areas where the flow could be improved. Have a colleague review your draft for feedback. Use tools like Grammarly and the Hemingway App for additional assistance. Ensure consistent formatting with clear fonts, headings, and subheadings. Double-check that all visuals are properly labeled and referenced.